
In the past, SEO professionals and business owners faced a persistent reporting challenge: daily performance data in Google Search Console would often fluctuate so sharply that it became nearly impossible to discern real trends or strategic performance shifts. These daily ups and downs obscured meaningful insights, making long-term planning and strategic reporting difficult for teams at every level — from solo SEO freelancers to enterprise marketing departments.
Finally, Google has addressed this issue by rolling out Google Search Console weekly and monthly views in performance reports, a long-asked feature that promises clearer trend analysis and stronger strategic decisions. Today’s post will walk you through everything this update means, how to use it, why it matters, and how businesses — especially those seeking an SEO agency partner — can benefit from adopting this powerful, time-based insight.
What Google Search Console Weekly & Monthly Views Mean for You
Before this update from Google Search Central, Search Console only showed performance data at daily granularity. While daily data is useful for spotting short-term issues — such as sudden drops due to site errors — it often hides the broader pattern of growth or decline. Fluctuations caused by weekends, algorithm updates, or campaign seasonality could make long-range analysis messy.
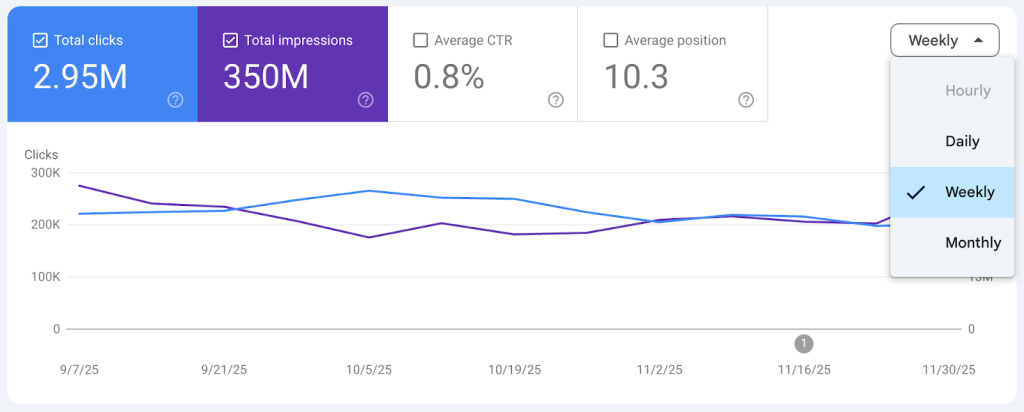
Image credit: Google Developers
Now, Search Console data range report let users smooth out the noise and see the bigger picture. Instead of focusing solely on day-to-day changes, website owners can choose weekly and monthly aggregations directly within the Performance report.
This update enhances the longstanding Search Console date range update capabilities, adding more choices. The new granularity selector lives alongside other filters and lets you instantly shift between daily, weekly, and monthly performance analytics. The metric calculations — clicks, impressions, average position, and CTR — remain consistent but aggregated over your chosen period.
With weekly SEO performance reporting and monthly SEO performance analytics, you can finally answer questions like:
- Are we truly improving quarter-over-quarter — not just spiking on launch days?
- How did a recent campaign affect monthly search visibility?
- Are seasonality patterns real or just random daily swings?
This is more than a simple UI tweak — it’s a strategic enhancement for long-term decision-making.
Explore our Google Updates to stay ahead of every algorithm shift.
Benefits for SEO Professionals & Marketers
Clarity Over Chaos
When you look at daily charts over long periods, spikes and dips make meaningful trends hard to spot. In contrast, weekly or monthly views convert 90 days of erratic data into a few clean trends that show real growth or decline. This can transform how you analyze performance after major site redesigns, content campaigns, or algorithm changes.
Better Performance Comparisons
One of the biggest advantages of weekly and monthly views is how they simplify comparing similar periods. For instance:
- Weekly aggregation smooths out day-of-week biases (e.g., a Monday vs. Friday comparison)
- Monthly views help align with financial reporting or campaign cycles
This matters especially when preparing reports for stakeholders or crafting strategies grounded in clearer evidence — no more debating whether a weekend dip was a real issue or just statistical noise.
Cleaner Communication with Clients & Teams
If you’re an agency or part of a marketing team, these aggregated views improve communication:
- Weekly summary charts become easier to explain during client calls
- Monthly dashboards align with monthly reviews and planning sessions
This makes weekly SEO performance reporting and monthly SEO performance analytics far more client-ready — without manually exporting and processing CSVs.
How to Switch to Weekly & Monthly Reporting
Google has thoughtfully placed the new options inside the familiar Performance report:
- Log in to Google Search Console and navigate to the Performance report.
- At the top of the chart, you’ll see a dropdown that currently defaults to “Daily.”
- Click the dropdown and choose Weekly or Monthly.
Once selected, the chart and table update immediately to reflect your choice. From here, you can apply filters — like queries, pages, countries, or devices — and the aggregated view persists while the metrics adjust accordingly.
Exporting data works similarly. When you download your performance data after selecting a weekly or monthly view, the exported file will use varied naming conventions and column headers suited to your chosen aggregation. This eliminates the need for manual pivot tables or time grouping.
Limitations You Should Know
While the update is powerful, there are a few limitations to understand:
Not a Ranking or Indexing Change
This is strictly a reporting feature. It does not change your site’s ranking, indexing, or crawling behavior. Daily, weekly, and monthly data are simply views of the same underlying performance metrics.
Still Depends on Data Freshness
Google Search Console sometimes experiences data delays — and that can affect how weekly or monthly charts appear. While these aggregated views help with trend spotting, they still rely on accurate, up-to-date underlying data. If there’s a reporting delay, your weekly or monthly charts may look unfinished until the data catches up. (
Not a Full Replacement for Daily Data
For diagnosing specific issues — such as a sudden drop after a technical error — daily data is still essential. Weekly and monthly views smooth trends, but sometimes the day you need is the one that tells the real story.
Conclusion
Google’s rollout of Google Search Console weekly and monthly views is a meaningful enhancement that empowers teams to make smarter, trend-driven decisions. By smoothing out daily volatility, these insights help reveal long-term storylines that drive strategic planning, campaign evaluations, and executive reporting.
For businesses evaluating SEO partners, this update also highlights the importance of choosing an agency that understands how to interpret and leverage high-level trends — not just daily variability. Weekly and monthly insights are now table stakes for any serious performance analytics strategy.
Ready to take your SEO analysis further?
Connect with 6S Marketers — our team specializes in translating Search Console time-based insights into action plans that drive real business impact.
FAQs
1. What are “weekly and monthly views” in Search Console?
Weekly and monthly views refer to new aggregation options in the Performance report that group clicks, impressions, CTR, and average position data into weekly or calendar monthly buckets, making long-term trend analysis easier.
2. Can I export weekly or monthly data from Google Search Console?
Yes, you can. Google Search Console now allows exporting weekly or monthly data. You can do this only when you switch the Performance report to that specific view.
3. Does this update include any new metrics?
No. This update does not add new metrics — but it gives you new ways to look at existing metrics over longer timescales without the daily volatility.
4. Can I still compare two date ranges using weekly views?
Yes! Weekly views retain the ability to compare custom date ranges, which can make period-over-period comparisons cleaner and less prone to day-of-week inconsistencies.
5. Will these views affect my API exports?
Right now, the Search Console API still returns daily values by default, but Google may extend API support for weekly and monthly options in future releases.