

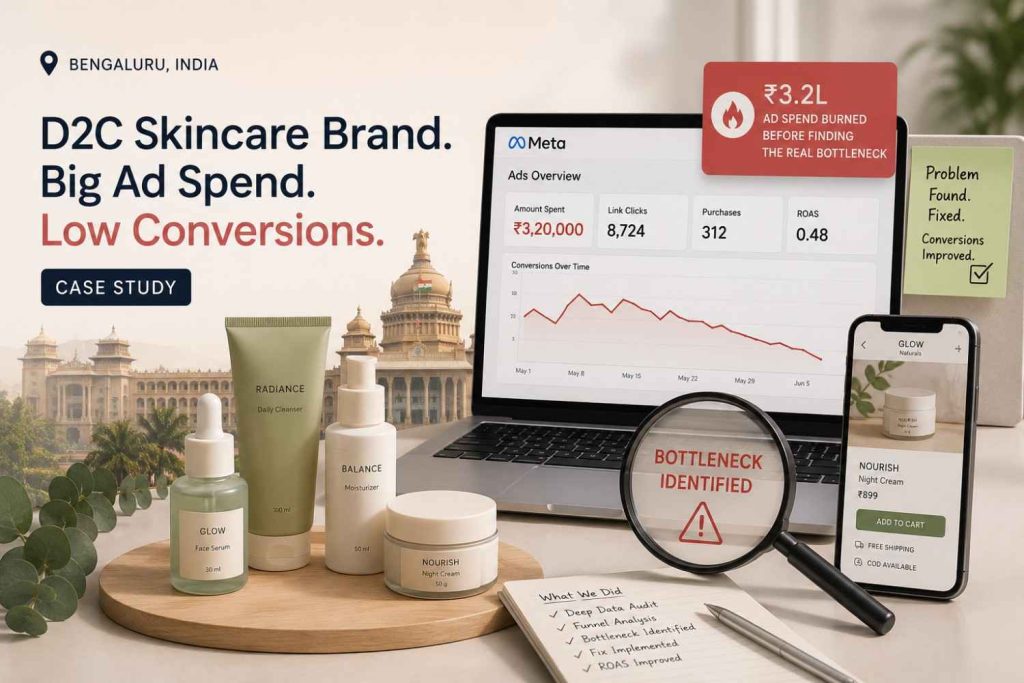
A Bengaluru skincare brand walked into our audit call in early 2026, holding a printout of their Ads Manager dashboard and one question: “Why isn’t this working?” Over ten weeks, they had put ₹3.2 lakh into campaigns that should have converted. They hadn’t. This D2C skincare Meta Ads case study isn’t a story about a creative refresh or a smarter targeting trick. It’s about what we found once we stopped staring at the ad account and started looking everywhere else — and why that shift saved more money than any campaign tweak could have. Client details are anonymized here to honor a confidentiality agreement, but every figure below reflects the real audit.
Key Takeaways
- ₹3.2L Meta spend, thin real returns.
- Checkout friction, not creatives, killed conversions.
- Broken COD confirmation inflated fake orders.
- Mobile page speed costs more than targeting.
- Funnel fixes lifted ROAS within weeks.
- Ad audits should start on-site first.
- CRO and paid media need alignment.
- The smaller ad budget outperformed the bigger one.
A D2C Skincare Meta Ads Case Study
The brand had been live for about fourteen months, selling mid-priced active-based skincare through its own Shopify store and two marketplaces. Monthly revenue sat around ₹45L, mostly organic and marketplace-driven. Meta ads were meant to be the next growth lever.
Their in-house team set up conversion campaigns with dynamic product ads and lookalike audiences built off past purchasers. Over ten weeks, they tested more than 40 creatives across 12 ad sets. Nothing unusual there, that’s a reasonable testing cadence for a beauty brand this size.
The spend: ₹3.2L. The blended ROAS is hovering between 0.9x and 1.1x. For context, most Indian D2C skincare brands need somewhere close to 2.5x just to break even once logistics and returns are counted. So on paper, this looked like a targeting problem, a creative problem, maybe even a “wrong platform” problem. The founder was ready to pause Meta entirely and shift the whole budget to Google Search.
That’s usually where the story starts going wrong; brands fix the channel before they’ve diagnosed the actual leak.
Why We Stopped Looking at the Ads First
Here’s the thing about this account: the media buying fundamentals were fine. CPCs (Cost for clicks) sat around ₹9-11, competitive for Bengaluru’s beauty and personal care vertical. CTR was healthy. Add-to-cart volume looked reasonable for the spend level.
So the ads were doing their job, pushing interested people to the site. Something downstream was the problem, not upstream.
If your Meta account shows healthy clicks and add-to-carts but flat revenue, that mismatch is usually the first flag worth chasing. It’s the pattern we look for before we ever touch a campaign. If that sounds familiar, it’s worth getting a full-funnel audit before reworking your ad budget, because the fix, more often than people expect, isn’t in the ad account at all.
What We Actually Audited
We pulled GA4 funnel data, session recordings, and Meta Events Manager logs side by side. Three weeks of overlapping data told a cleaner story than any single dashboard could.
What we checked, in order:
- Mobile checkout completion rate versus desktop.
- PDP (Product Detail Page) load time on actual 4G speeds, not office WiFi.
- The COD (cash on delivery) confirmation flow, end-to-end.
- Whether Meta’s Purchase event was even firing correctly.
- RTO (Return to Origin) data segmented by traffic source.
That last point matters more than most brands realize. This is the same cross-channel audit lens we bring to every paid search marketing engagement. You can’t judge a channel’s ROAS in isolation from what happens after the click.
The GA4 funnel showed something odd almost immediately: 68% of mobile users who reached checkout never completed it. Desktop completion was nearly three times higher. Ad quality couldn’t explain that gap. Something on the site could.
The Real Bottleneck And Why It Had Nothing to Do With Creatives
Two things, actually, stacked on top of each other.
First: a theme update three months earlier had quietly broken the address-autofill plugin on mobile checkout. Customers typing their address hit a field that wouldn’t populate PIN codes correctly. Most gave up. Nobody on the team had noticed because nobody tests checkout on a throttled mobile connection once a product ships.
Second, and this one stung more: the Cash On Delivery(COD) confirmation SMS — the message that verifies a cash-on-delivery order before it’s dispatched — had stopped firing weeks earlier after an API key expired quietly in the background. Without that confirmation step, impulse and fake COD orders were sailing straight through. Many of those orders were never delivered at all.
That’s the twist at the center of this D2C skincare Meta Ads case study: paid traffic looked unprofitable, but a meaningful chunk of “converted” orders was doomed the moment they were placed. RTO on Meta-driven orders was running close to 32%, well above the brand’s own historical average. The ad account was being blamed for a logistics leak it had nothing to do with.
What We Fixed and in What Order
Sequence mattered here as much as the fixes themselves.
Week 1: Checkout
The dev team patched the address-autofill bug and stripped an unnecessary form field that was adding friction on mobile. Small change, immediate lift in checkout starts.
Week 2: Speed
The PDP was auto-playing a background video that pushed mobile load time to nearly 8 seconds. We deferred it to load on interaction instead. Load time dropped to under 3 seconds.
Week 3: COD verification.
Restored the confirmation SMS and layered in a WhatsApp confirmation step before dispatch, cutting down on fake and impulse COD orders before they ever reached a courier.
Week 4: Onward with the ad account.
Only after the funnel was stable did we touch targeting: trimmed underperforming ad sets, consolidated overlapping audiences, and reallocated budget toward the creatives that had quietly been converting well all along — the problem was never the creative, so nothing here got rewritten. This is also usually the point where a brand needs to decide on a channel mix between Google Ads and Meta Ads, and having clean funnel data made that call far easier.
The Results: ROAS Before, During, and After
Before (weeks 1-10): ₹3.2L spent, blended ROAS between 0.9x and 1.1x, RTO on Meta orders around 32%.
During (weeks 11-14, funnel fixes rolling out, ad account untouched): ROAS climbed to roughly 1.8x on the same campaigns; no new budget was added. That lift came entirely from checkout and speed fixes.
After (weeks 15-20, funnel stable plus a leaner ad account): ROAS reached approximately 3.4x on a monthly spend of about ₹1.1L — nearly a third of the original weekly burn rate. RTO on Meta-driven orders dropped to around 14%, closer to industry benchmarks for brands with solid COD verification in place. Independent industry data on this front lines up with what we saw: prepaid RTO in Indian e-commerce typically sits under 8%, while unverified COD orders commonly run between 20% and 35% — a gap that alone can make a healthy ad channel look like a failing one.
Net effect: less money spent on Meta, more revenue attributed to it, and a logistics bill that shrank alongside the ad spend.
What Every Indian D2C Brand Should Check Before Blaming the Ads
Before you pause a campaign or fire an agency, run this checklist:
- Mobile checkout completion rate, measured separately from desktop
- Page load speed tested on real 4G, not office broadband — Google’s own mobile speed research has repeatedly tied load time directly to bounce and conversion behavior
- Whether COD orders are verified before dispatch
- RTO rate broken out by traffic source, not blended
- Whether ROAS is calculated on gross revenue or net of returns and RTO
- Whether the Purchase event in Ads Manager actually matches order data in your store backend
Most brands running a D2C skincare Meta Ads case study of their own will find at least one of these quietly working against them. If you want a second pair of eyes on your funnel, our team is happy to run a funnel audit alongside your existing media plan.
Conclusion
₹3.2 lakh isn’t a huge budget by enterprise standards, but for a fourteen-month-old brand, every rupee needs to earn its keep. The mistake wasn’t the media plan, the creatives, or even the targeting; it was assuming the ad account was where the problem lived, simply because that’s where the spend was visible. This D2C skincare meta ads case study is really a case study about sequencing: fix what happens after the click before you touch what happens before it. A checkout bug and a broken SMS integration cost this brand more than any underperforming ad set ever could have. The ad account, once the funnel was sound, did exactly what it was built to do.
So here’s a question worth sitting with: how much of your own “underperforming” ad spend might actually be a checkout, speed, or verification problem wearing an ad account’s name tag?
External Sources